 English
 Русский
Overview page
The Overview page is the first screen after you log in. It shows whether your proxies are working, how much they’re used, and what you’ll be charged next.
Before your first purchase, the page offers two options: Buy proxies or a paid 48-hour trial. Once you have a service, it switches to the layout below.
Summary
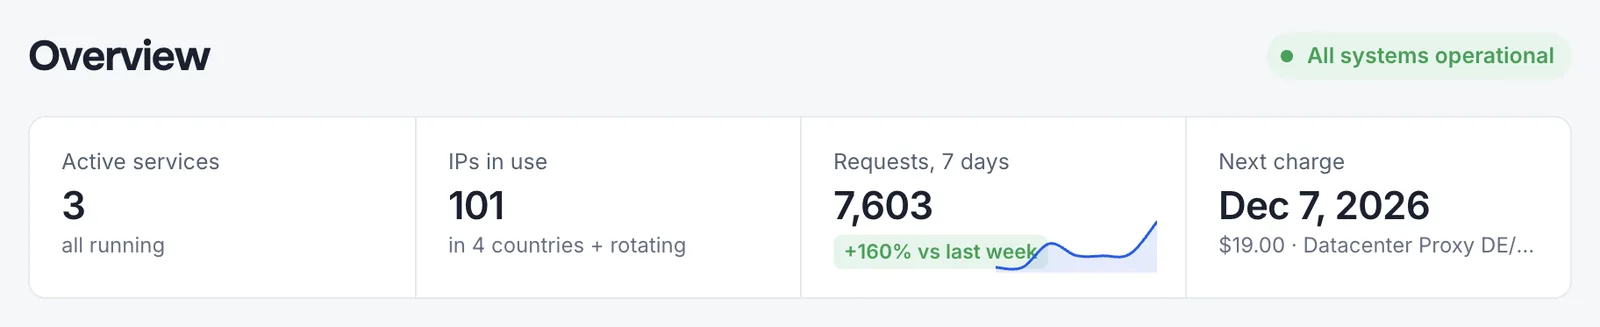
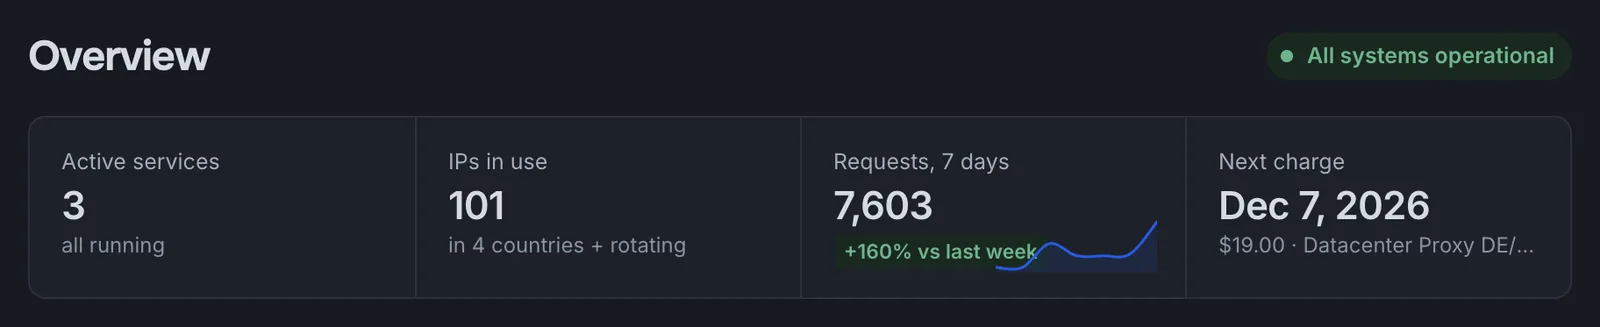
The status line at the top reports the network state: all systems operational, scheduled maintenance, or an incident with a link to details. Below it are four figures:
| Figure | What it shows |
|---|---|
| Active services | How many services are running, and how many are suspended. |
| IPs in use | The total number of IPs and countries, plus a note if you also have rotating proxies. |
| Requests, 7 days | Requests through your proxies over the past week, compared with the week before. |
| Next charge | The date, amount, and service of the next renewal. |
Activity chart
The chart shows requests through your proxies for each service over 24 hours, 7 days, or 30 days. Total stacks services on top of each other; Compare draws them as separate lines. Click a service under the chart to add it or remove it; up to five services fit on the chart at once.
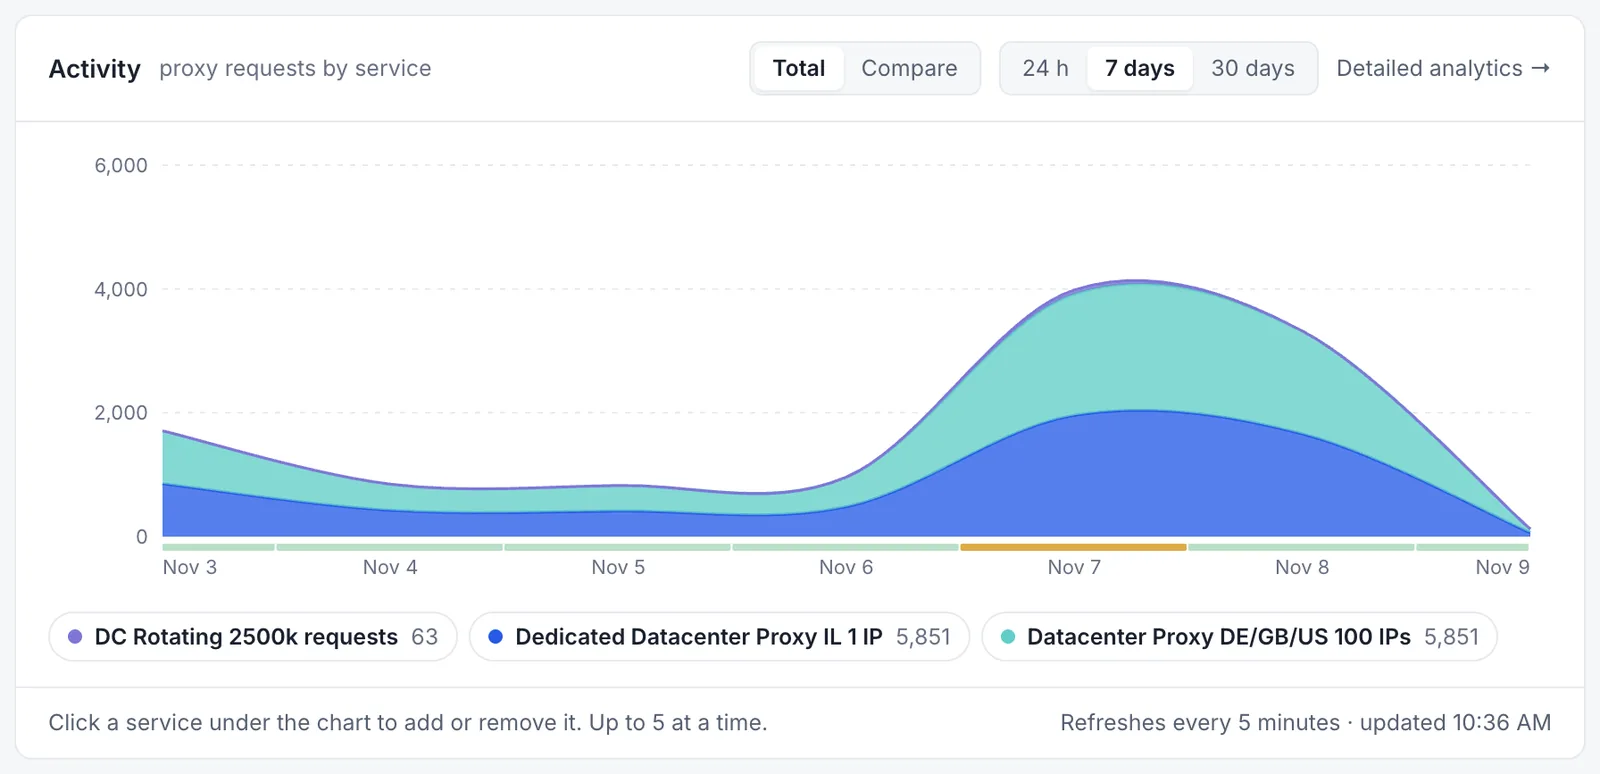
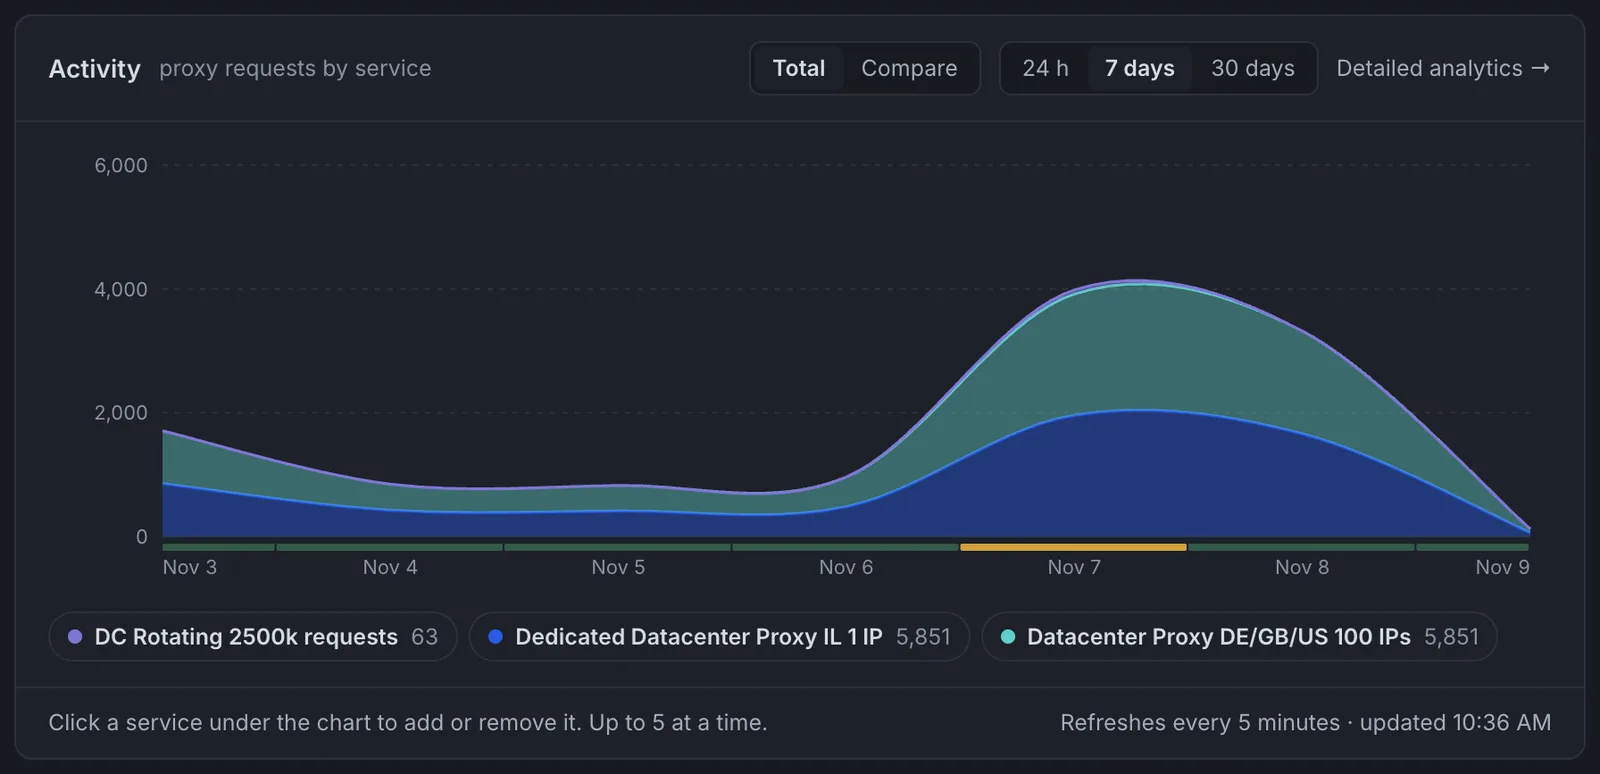
The data refreshes every 5 minutes. For error causes, response times, and target websites, follow Detailed analytics to the Analytics page.
My services
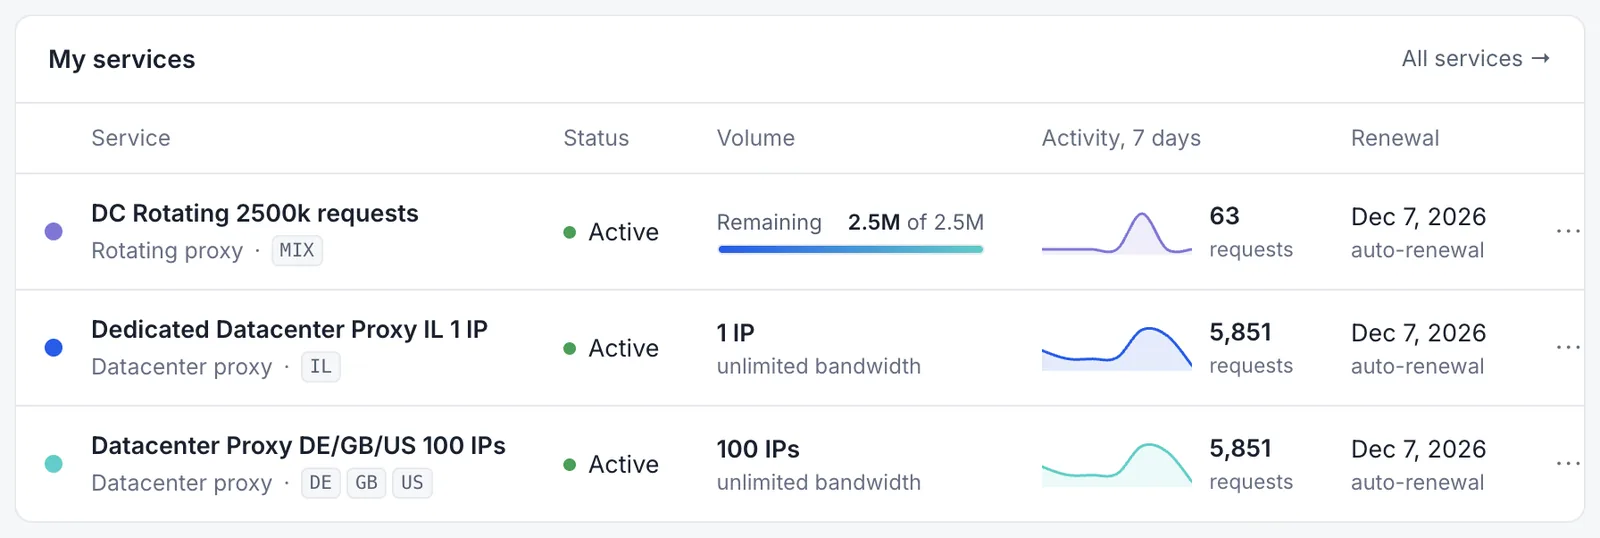
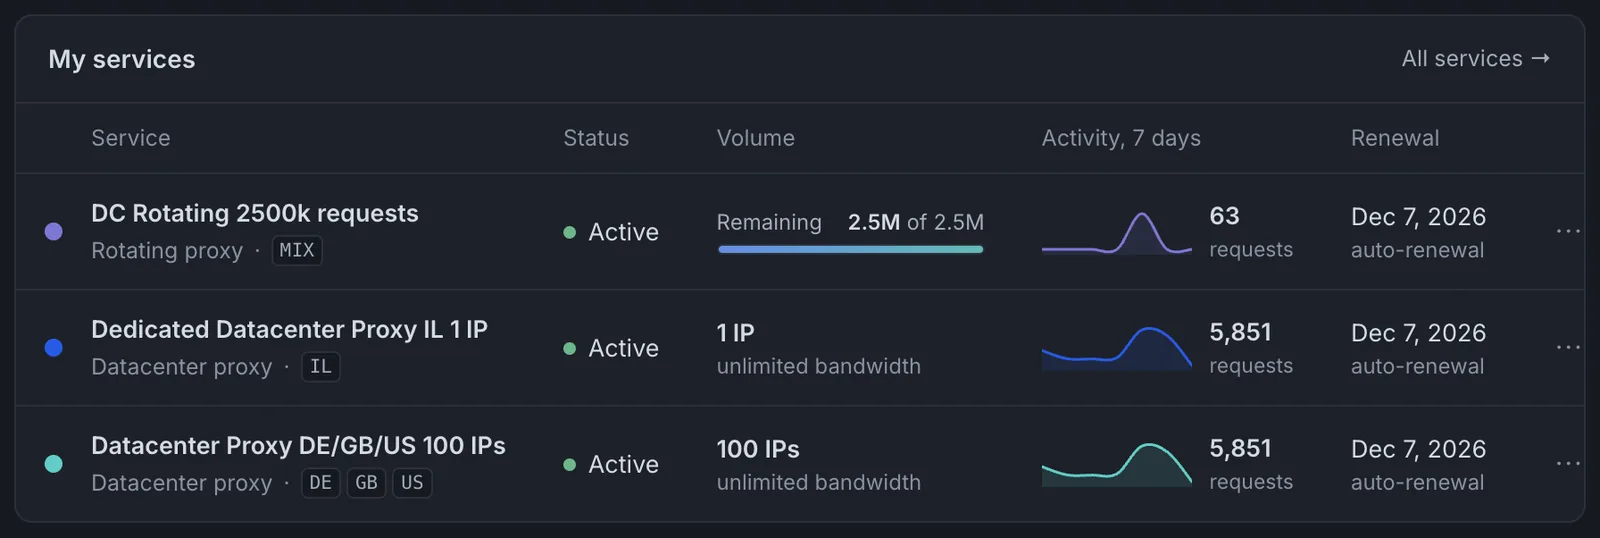
A compact table of your services: status, volume (number of IPs, or requests left on a rotating plan), activity over 7 days, and the renewal date. Click a row to open the service page. The full list with filters is in My proxies.
Upcoming charges
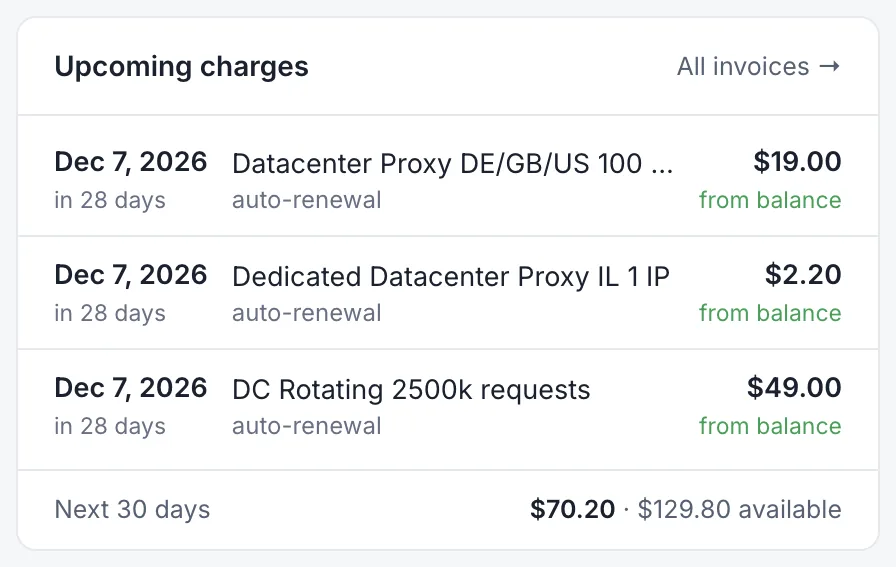
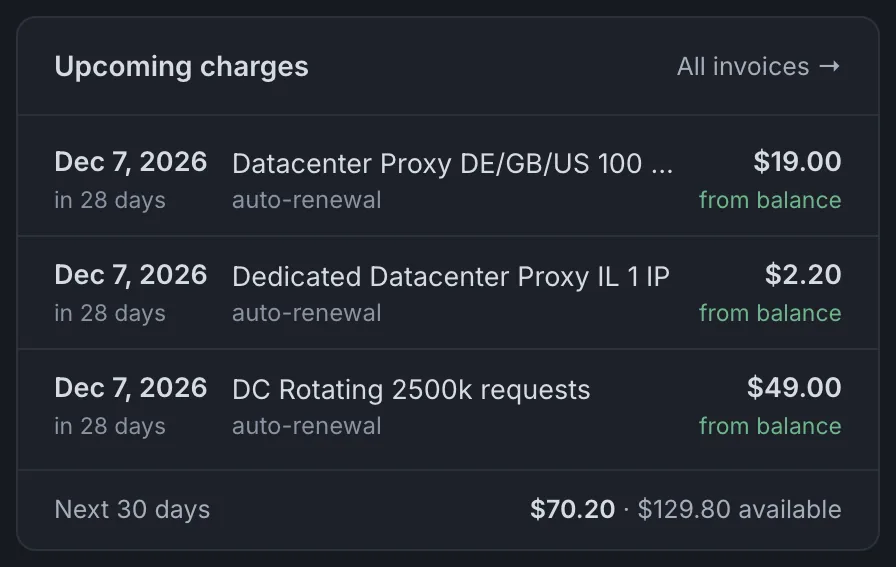
Every renewal due in the next 30 days, with its date, amount, and how it will be paid: from your balance, from a saved card, or manually. At the bottom, the total is compared with your current balance, so you can see whether you need to add funds before the renewal date.
Needs attention
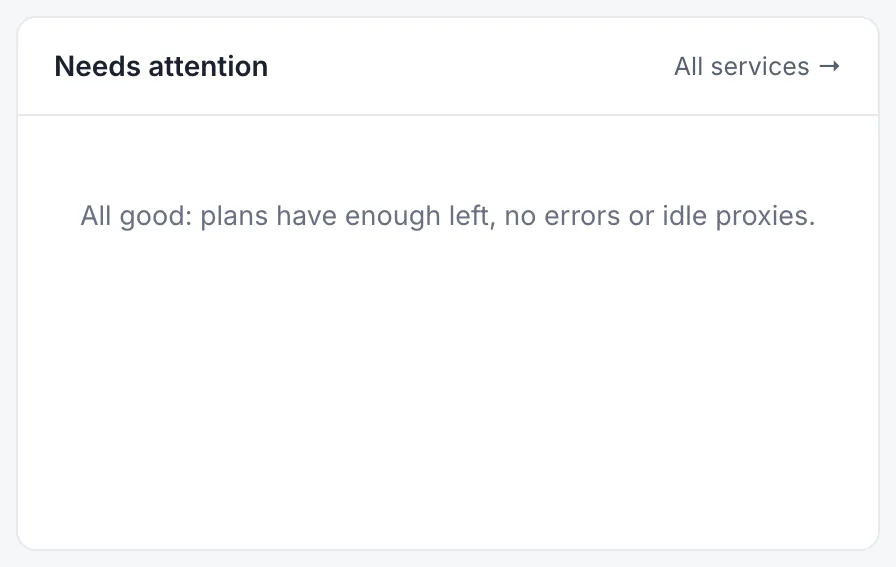
This block collects issues that need action: an unpaid invoice, a suspended service, a plan running low on requests, or a service with no requests for 7 days. When nothing needs attention, it confirms that plans have enough volume and there are no errors or downtime.
The tiles below lead to the MCP server and to proxy setup guides for browsers, anti-detect browsers, Python, and Node.js.
Last updated: November 9, 2026.